jInbound's Dashboard is where you create your inbound marketing campaigns and monitor their performance.
You can divide the Dashboard into the following six areas:
- The top toolbar area with two buttons.
- The graphical wizard section.
- The left main navigation menu.
- The overall monthly reporting snapshot block.
- The top performing landing pages.
- The area listing the recent leads.
Dashboard Area #1 - The top toolbar

At the top toolbar, you will see two buttons:
- The Reset button.
- The Options button.
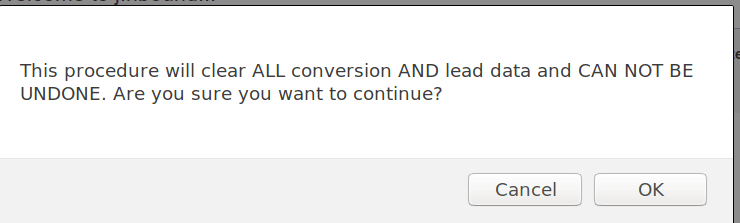
The Reset button allows you to clear all the conversions and leads statistics. This would be useful when you, for example, finished testing your inbound marketing campaign(s) and would like to launch the campaign(s) in a production mode.
When you click the Reset button, jInbound will display a dialog box:
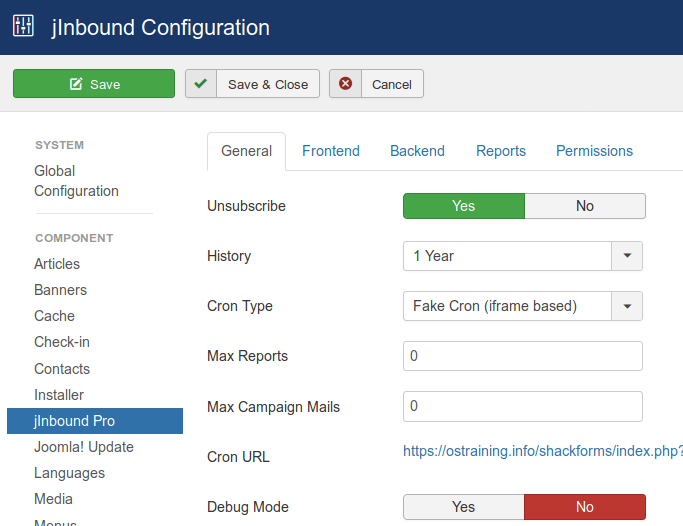
The Options button gives you access to the jIinbound Configuration administrative page:
Dashboard Area #2 - The graphical wizard
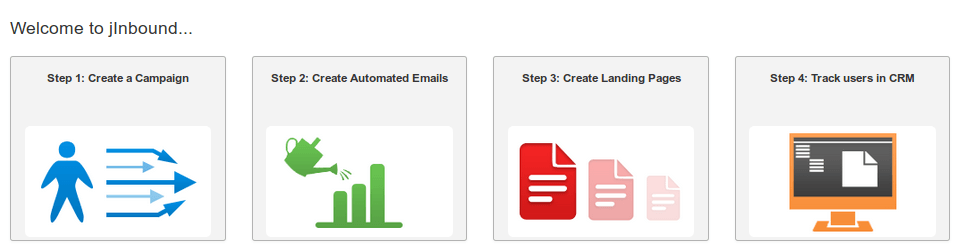
The four graphics in this area instruct you how to properly build up your inbound marketing campaigns.
- Create a new marketing campaign to gain leads and convert them according to the campaign goal.
- Create follow up emails to automatically nurture the campaign leads and push them down the customer funnel.
- Create landing pages to start gaining leads.
- Track and monitor users.
Dashboard Area #3 - The left navigation menu
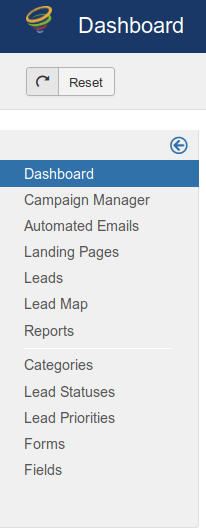
This left navigation menu provides you with a quick access to jInbound's main administrative areas.
Dashboard Area #4 - The Overall Monthly Reporting Snapshot
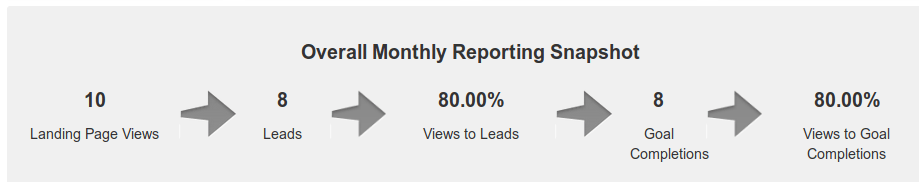
Once your inbound marketing campaign starts getting some results, you will see the following statistics in this area:
- A number of views your inbound marketing campaign generated.
- A number of leads gained.
- Percentage of views to leads conversion.
- A number of leads converted to your inbound marketing goals.
- Percentage of landing pages that led to marketing goal completion.
Dashboard Area #5 - The Top Performing Landing Pages
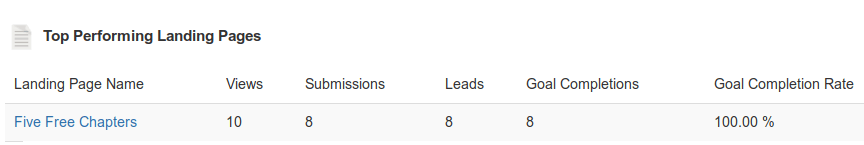
In this area, you will see the top 10 performing landing pages with the following data:
- The landing pages name.
- A number of their views.
- A number of their submissions.
- A number of leads each of them generated.
- A number of goal completions each of them led to.
- Their goal completion percentage.
Once you evaluate the performance of one of your top landing pages, you can click on the page name and open it if you wish to tweak it.
Dashboard Area #6 - The Recent Leads
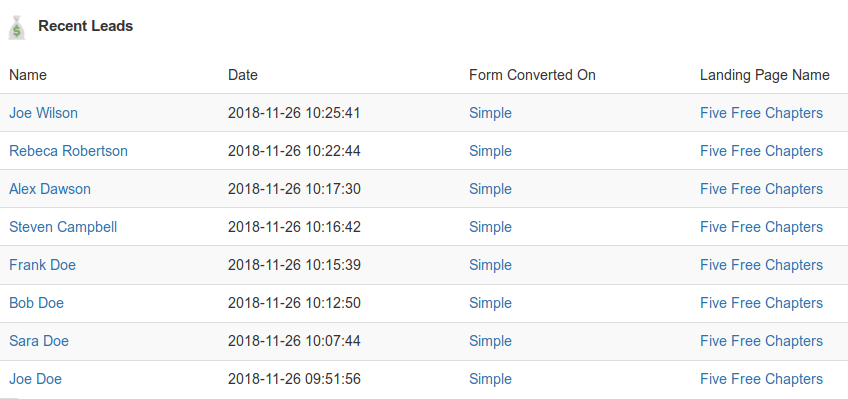
The Recent Leads table provides you with:
- The lead name.
- The date when the lead was gained.
- The form that the lead submitted.
- The landing page that converted the lead.